◆ TF(Term Frequency) 계산
from sklearn.feature_extraction.text import CountVectorizer

def main():
    df = pd.read_excel('./df.xlsx')

    listdf = list(df["내용 토큰화"].values.astype('U'))
    vectorizer = CountVectorizer(tokenizer=local_tokenizer)

    count = vectorizer.fit_transform(list(df["내용 토큰화"].values.astype('U')))
    count = pd.DataFrame(count.toarray(), columns = vectorizer.get_feature_names_out())
    count = count.sum()
    count = pd.DataFrame(count)

    # 전체 토큰에 대해서 TF count가 필요없고, 상위 n개가 필요할 경우
    count = count[0].nlargest(maxWordForTF)
    print('\r\n> nlargest')
    print(count)

    count.to_excel('./count_tf.xlsx', index=True, header=False)
    print('> exported count_tf.xlsx')
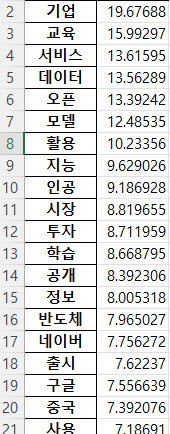
앞서 진행한 정제 작업 후 생성해둔 data frame 파일(df.xlsx)로 부터 토큰 데이터를 읽어와서,
문서별로 토큰 출현 횟수를 계산하게 하였다. maxWordForTF 는 숫자이다. 100개 200개 정도 수준으로 필요한 갯수만 상위에서 잘라내도록 했다. 이 숫자 이하로 WordCloud에 표시될 단어 수나 Plot-bar/네트워크 그래프에 표시될 개수를 맞추게 될 것이다.
결과 엑셀은 대략 이런 모습으로 저장될 것이다.

◆ TF-IDF (Inverse Document Frequency)
from sklearn.feature_extraction.text import TfidfVectorizer

def main():
    df = pd.read_excel('./df.xlsx')
    tfidfvect = TfidfVectorizer(tokenizer=local_tokenizer)
    tfidfvect.fit(list(df["내용 토큰화"].values.astype('U')))

    tfidf = tfidfvect.transform(list(df["내용 토큰화"].values.astype('U')))
    feature_names = tfidfvect.get_feature_names_out()

    tfidf = pd.DataFrame(tfidf.toarray(), columns=feature_names)
    tfidf = tfidf.sum().to_frame()

    tfidf_excel = tfidf[0].nlargest(maxWordForTFIDF)
    print(tfidf_excel)

    tfidf_excel.to_excel('./tfidf.xlsx', index=True, header=True)
    print("> tfidf exported")
maxWordForTFIDF 변수에도 필요한 토큰수만큼 써주자.
결과 엑셀은 대략 이런 모습으로 저장될 것이다.

토크나이저는, 우리가 이미 정제후에 특수기호 "|"로 join해서 저장했기때문에, 단순히 "|"로 split해서 리턴해주면 되겠다.
def local_tokenizer(text):
    tokens = text.split('|')
    tokens_l = [token.lower() for token in tokens]
    return tokens_l
◆ TF-IDF 기준으로 Plotbar 그리기
위 tf-idf 계산 코드 아래에 아래처럼 plot bar를 그리는 코드를 추가해서 파일로 그릴 수 있다
(maxWordForPlotBar 값에도 보여주고 싶은 키워드 갯수를 쓴다)
    tfidf_plotbar = tfidf[0].nlargest(maxWordForPlotBar)
    fig = tfidf_plotbar.plot(kind='bar', figsize=(40, 20), fontsize=20).get_figure()
    plotbar_file_name = "./plot_bar.png"
    fig.savefig(plotbar_file_name)
    print("> plotbar image exported to ", plotbar_file_name)
대략 이런 이미지가 나올것이다.

'SW Project > 빅데이터 키워드 네트워크 분석' 카테고리의 다른 글
| 빅데이터 키워드 분석 : 연결 중심성, 위세 중심성 계산 (Centrality) (0) | 2023.11.19 |
|---|---|
| 빅데이터 키워드 분석 : 동시 출현 빈도 계산 (0) | 2023.11.19 |
| 빅데이터 키워드 분석 : 개발환경, 데이터 정제 (0) | 2023.11.19 |
| 빅데이터 키워드 분석 : 데이터 수집 (0) | 2023.11.19 |
| 빅데이터 키워드 분석 : 목표 (0) | 2023.11.19 |