이전에 올린 캔들 차트 그리기에 한가지 기능을 추가해보려고 한다.
window.localStorage를 이용하면 key, value 쌍으로 데이터를 저장할 수 있다.
이를 이용해서, 이전에 선택했던 값(코인 종류)을 저장해놓고, 다음에 브라우저를 열었을 때, 해당 선택값으로 초기화해서 다시 시작하는 것이다.
* LocalStorage 적용 버전 테스트해보기 → Local Storage exam (sparrow-lee.github.io)
Local Storage exam
sparrow-lee.github.io
브라우저 Javascript Candle Chart 그리기 :: 코딩하는 참새 (tistory.com)
브라우저 Javascript Candle Chart 그리기
HTML + Javascript를 이용하여 브라우저에 아래와 같은 캔들 차트를 그려보자. * 차트 예시 실행해보기 → Draw chart exam (sparrow-lee.github.io) Draw chart exam sparrow-lee.github.io 위 예시 데이터는 비트코인
codesparrow.tistory.com
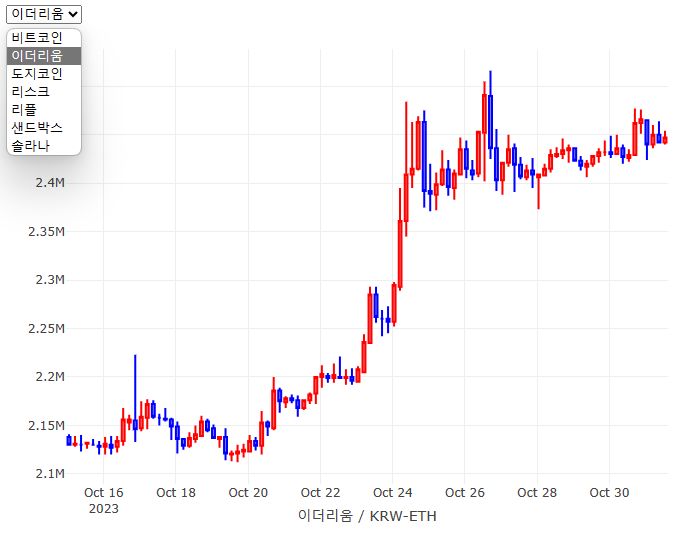
이전 예시에서는 비트코인 한가지 차트를 보여줬지만, 콤보박스를 추가해서 다른 코인도 선택가능하게 하고,
선택된 코인을 localStorage에 저장해 놓고, 다음번에도 같은 코인을 보여주게 하는 것이다.
        function setData(key, value) {
            window.localStorage.setItem(key, value);
        }

        function getData(key) {
            let value = window.localStorage.getItem(key);
            return value;
        }

        // 콤보박스가 변경되었을 때, 선택된 코인 마켓id를 저장하고, 차트를 다시 그린다.
        async function selectMarketOnChange(index, value, text) {
            setData('market', value);
            selectedMarket = value;
            let unit = '240';
            let name = COIN_DICT[selectedMarket].name;
            let res = await getBitPrice({count: 100, market: selectedMarket, unit, name});
            drawChart(res.trace, res.info);
        }
예시에서는 7개의 코인만 static하게 추가해두긴 했는데, 업비트에서 제공하는 다른 Rest API를 이용하면
업비트에 상장된 전체 코인 리스트도 받아 올 수 있다. 그래서, 동적으로 콤보박스의 옵션을 추가하는 것도 가능하겠다.
        async function getAllCode() {
            let url = `https://api.upbit.com/v1/market/all`;
            const response = await fetch(url);
            const codes = await response.json();
            ...
localStorage에는 다른 기능도 더 있긴하다.
window.localStorage.removeItem('myKey'); // 해당 키값에 해당하는 key, value 삭제

window.localStorage.clear();  // 전체 삭제
다만, 주의할 것이, html 파일별로 localStorage가 분리되어 저장되는 것은 아니고, 브라우저별로 별도 저장되는 것으로 보이므로, 다른 html문서에서 저장한 localStorage의 key값과 중복되지 않도록 unique한 이름으로 하는 것이 좋아 보인다.
동적으로 콤보박스의 옵션을 추가하는 것은,
            // 선택 가능한 코인 리트스로 option 추가
            let selectMarketElement = document.getElementById("selectMarket");
            let option = document.createElement("option");

            for (let i = 0; i < COIN_LIST.length; i += 1) {
                option = document.createElement("option");
                option.text = COIN_LIST[i].name;
                option.value = COIN_LIST[i].market;
                selectMarketElement.appendChild(option);
            }
select tag로 아이템 추가. 선택 변경이 있을 때, selectMarketOnChange 함수가 불리게 했다.
<select name="selectMarket" id="selectMarket" onchange="selectMarketOnChange(this.selectedIndex, this.value, this.options[this.selectedIndex].text)">
콤보박스가 변경되었을 때 실행되는 함수. localStorage에 저장하고, 차트 다시 그리기
        async function selectMarketOnChange(index, value, text) {
            setData('market', value);
            selectedMarket = value;
            let unit = '240';
            let name = COIN_DICT[selectedMarket].name;
            let res = await getBitPrice({count: 100, market: selectedMarket, unit, name});
            drawChart(res.trace, res.info);
        }
아래는 전체 코드
<html lang="ko">
<head>
    <meta name="viewport" content="width=device-width,initial-scale=1,maximum-scale=1,user-scalable=no"/>
    <meta charset="utf-8" />
    <title>Local Storage exam</title>
    <script src="https://cdn.plot.ly/plotly-2.27.0.min.js" charset="utf-8"></script>
    <script>
        let COIN_LIST = [
            { idx: 0, market: "KRW-BTC", name: "비트코인"},
            { idx: 1, market: "KRW-ETH", name: "이더리움"},
            { idx: 2, market: "KRW-DOGE", name: "도지코인"},
            { idx: 3, market: "KRW-LSK", name: "리스크"},
            { idx: 4, market: "KRW-XRP", name: "리플"},
            { idx: 5, market: "KRW-SAND", name: "샌드박스"},
            { idx: 6, market: "KRW-SOL", name: "솔라나"},
        ];
        let COIN_DICT = {};
        let selectedMarket = '';

        async function onLoad() {
            console.log('onLoad')
            init();
            console.log(JSON.stringify(window.localStorage));
            // 선택 가능한 코인 리트스로 option 추가
            let selectMarketElement = document.getElementById("selectMarket");
            let option = document.createElement("option");

            for (let i = 0; i < COIN_LIST.length; i += 1) {
                option = document.createElement("option");
                option.text = COIN_LIST[i].name;
                option.value = COIN_LIST[i].market;
                selectMarketElement.appendChild(option);
            }

            // 이전에 선택했던 코인으로 선택된 상태로 설정
            let unit = '240';
            let name = COIN_DICT[selectedMarket].name;
            selectMarketElement.selectedIndex = COIN_DICT[selectedMarket].idx;

            // 차트 그리기
            let res = await getBitPrice({count: 100, market: selectedMarket, unit, name});
            drawChart(res.trace, res.info);
        }

        function init() {
            COIN_LIST.forEach(coin => {
                COIN_DICT[coin.market] = coin
            })
            console.log(COIN_DICT);
            selectedMarket = getData('market');
            if (!selectedMarket) {
                selectedMarket = 'KRW-BTC';
            }
            console.log('init done');
        }

        function setData(key, value) {
            window.localStorage.setItem(key, value);
        }

        function getData(key) {
            let value = window.localStorage.getItem(key);
            return value;
        }

        async function selectMarketOnChange(index, value, text) {
            setData('market', value);
            selectedMarket = value;
            let unit = '240';
            let name = COIN_DICT[selectedMarket].name;
            let res = await getBitPrice({count: 100, market: selectedMarket, unit, name});
            drawChart(res.trace, res.info);
        }

        async function getBitPrice({count, market, unit, name}) {

            let url = `https://api.upbit.com/v1/candles/minutes/${unit}?market=${market}&count=${count}`;
            const response = await fetch(url);
            const prices = await response.json();
            console.log(prices);

            let pricesSorted = prices.sort((a, b) => a.timestamp - b.timestamp);    // 시간순으로 정렬

            let x = [];
            let high = [];
            let low = [];
            let open = [];
            let close = [];

            let info = {};
            // 차트 그릴 때, 최소, 최대값 range를 설정하기 위해.
            lowest_price = pricesSorted[0].low_price;
            highest_price = pricesSorted[0].high_price;
            pricesSorted.forEach((p) => {
                x.push(p.candle_date_time_kst);
                high.push(p.high_price);
                low.push(p.low_price);
                open.push(p.opening_price);
                close.push(p.trade_price);

                lowest_price = lowest_price > p.low_price ? p.low_price : lowest_price;
                highest_price = highest_price < p.high_price ? p.high_price : highest_price;
            })

            info = {
                lowest_price,
                highest_price,
                market,
                name
            }

            // 차트 그릴 때 필요로 하는 정보들. 캔들값을 배열로.
            let trace = {
                x,
                high,
                low,
                open,
                close,
                decreasing: {line: {color: 'blue'}},
                increasing: {line: {color: 'red'}},
                line: {color: 'rgba(31,119,180,1)'},
                type: 'candlestick',
                xaxis: 'x',
                yaxis: 'y'
            }
            console.log(info);
            console.log('>> getBitPrice done')
            return {trace, info};
        }
        function drawChart(trace, info) {
            var data = [trace];

            var layout = {
                dragmode: 'zoom',
                margin: {
                    r: 10,
                    t: 25,
                    b: 40,
                    l: 60
                },
                showlegend: false,
                xaxis: {
                    autorange: true,
                    domain: [0, 1],
                    //range: ['2017-01-03 12:00', '2017-02-15 12:00'],
                    range: [trace.x[0], trace.x[trace.x.length - 1]],
                    rangeslider: {range: [trace.x[0], trace.x[trace.x.length - 1]]},
                    title: info.name + ' / ' + info.market,
                    type: 'date',
                    rangeslider: {
                        visible: false
                    }
                },
                yaxis: {
                    autorange: true,
                    domain: [0, 1],
                    range: [info.lowest_price * 0.95, info.highest_price * 1.05],
                    type: 'linear'
                }
            };

            Plotly.newPlot('chartDiv', data, layout);
            console.log('>> drawChart done')
        }
    </script>
</head>
<body onload="onLoad()">
    <select name="selectMarket" id="selectMarket" onchange="selectMarketOnChange(this.selectedIndex, this.value, this.options[this.selectedIndex].text)">
    </select>
    <div id="chartDiv" style="width:100%;height:500px;"></div>
</body>
</html>
Github 소스코드 참고
exam-codes-public/javascript/local-storage.html at main · sparrow-lee/exam-codes-public (github.com)
'SW 개발 참고 > Javascript' 카테고리의 다른 글
| 나만의 비트코인 차트 만들기 (HTML, JS) (0) | 2023.11.19 |
|---|---|
| Bootstrap을 이용하여 손쉽게 예쁜 UI 구성 (0) | 2023.11.19 |
| 브라우저 Javascript Candle Chart 그리기 (0) | 2023.11.19 |
| 브라우저 Javascript로 Rest API 요청하기 (0) | 2023.11.19 |
| Javascript JSON 사용하기 (0) | 2023.11.18 |